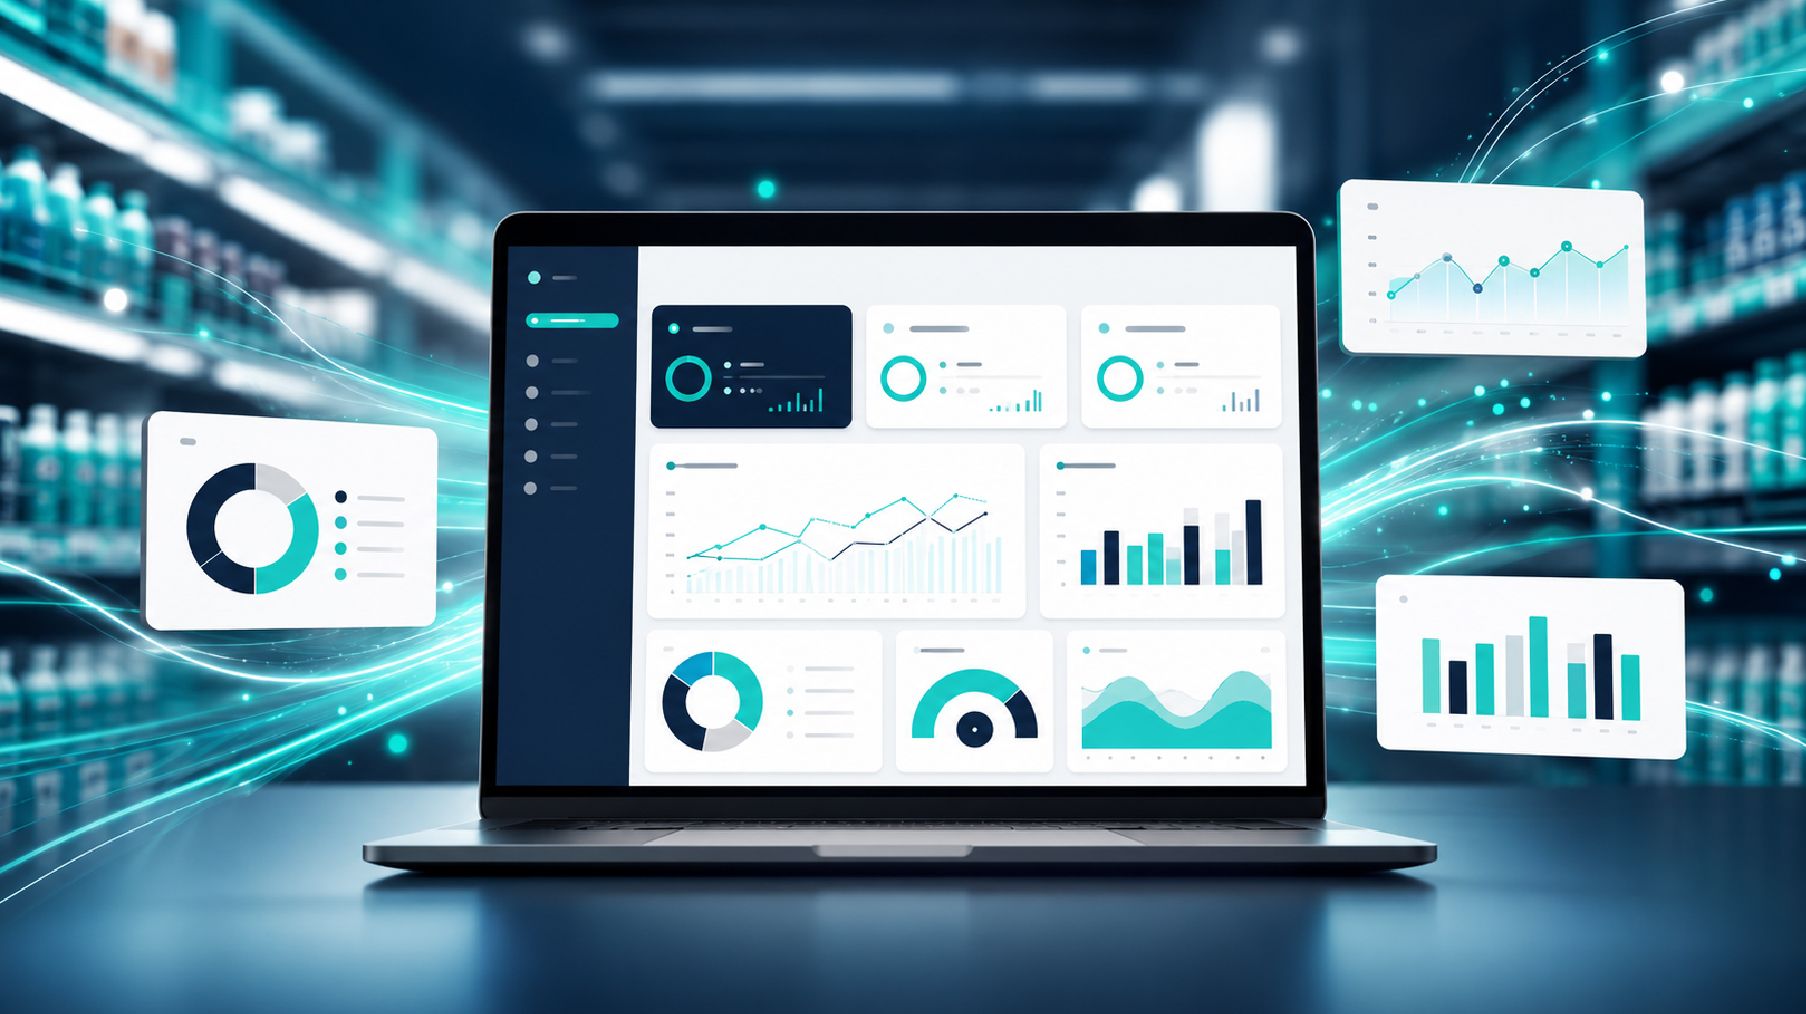
AI Agents for Cross-Department Reporting

WorkAgentic builds AI agents for cross-department reporting that pull the same defined metric from every department and present it side by side, so leadership stops assembling that comparison by hand each cycle.

★★★★★4.9 / 5
No technical team neededBuilt by CPAs
Book a Free Reporting Automation Review

No commitment. Response within 24 hours.

Cross-Department Reporting

Six cross-department reporting tasks your team stops running manually

Each agent pulls the same metric from every department and compares it automatically. No manual reformatting, no outlier discovered only after someone compared the numbers by hand.

Standardized Metric Definitions

  • Each metric defined once and applied consistently across every department
  • No distortion from a department calculating a metric slightly differently
  • Definitions documented and visible alongside the report itself
  • Definition changes applied uniformly the moment they are updated
  • New metrics added to the comparison without disrupting existing ones

Automatic Department Data Pull

  • Data pulled automatically from every department, no manual collection
  • Each department's own system connected as it is, no shared platform required
  • Data pulled on the schedule each department actually reports on
  • Missing or delayed department data flagged instead of silently skipped
  • New departments added to the pull without disrupting existing ones

Side-by-Side Comparison Views

  • Every department's number displayed side by side for direct comparison
  • Comparison view configured to match how leadership actually reviews departments
  • Each department's own detailed reporting still available alongside the comparison
  • View updated automatically as each department reports new numbers
  • No manual reformatting required to line up departments consistently

Ranking and Benchmark Reporting

  • Departments ranked against each other automatically on any defined metric
  • Departments compared against a defined benchmark, not just each other
  • Ranking updated automatically as new department data arrives
  • Ranking criteria configured to reflect what actually matters for the metric
  • Trend in ranking over time visible, not just a single snapshot

Anomaly Detection Across Departments

  • A department whose numbers fall outside the pattern flagged automatically
  • Detection based on comparison across departments, not just one in isolation
  • Genuine outliers distinguished from expected regional or seasonal variation
  • Flagged departments surfaced within the report, not buried in raw numbers
  • Detection thresholds refined over time as real patterns accumulate

Reporting History and Audit Log

  • Every comparison run logged with a timestamp and the underlying data
  • Historical department performance available for comparison without manual reconstruction
  • Corrections tracked so the original and revised numbers are both visible
  • Trend data available across any period leadership needs to review
  • History retained even after underlying department systems have changed

Client Reviews

What operations teams say after going live

4.8
★★★★★
Verified clients
★★★★★

Comparing revenue across our twelve regional offices meant collecting numbers from each one and reformatting them consistently by hand every month. WorkAgentic pulls them all automatically now, side by side, ready to compare.

★★★★★

Two regions calculated the same expense category differently, which made our comparison across all four regions meaningless until someone caught it manually. WorkAgentic standardizes the definition across every region now, so the comparison is finally accurate.

★★★★★

One department was running well behind the rest on a key metric for two straight quarters and nobody flagged it until year-end review. WorkAgentic surfaces an outlier department automatically now, well before it turns into a bigger conversation.

★★★★★

Ranking our departments by headcount efficiency used to mean building a manual spreadsheet every quarter just to see who was ahead. WorkAgentic ranks departments automatically now against the metric and against benchmark.

★★★★★

Adding a new store region to our comparison used to mean rebuilding the entire report from scratch to fit it in. WorkAgentic adds a new department to the comparison now without touching anything else.

Our Process

How we deploy your cross-department reporting agent

Five structured steps from scoping to go-live. No disruption to any department existing systems or workflows.

01
Discovery and Department Metrics Audit
Free 30-minute call. We map which metrics get compared across departments today, how they are currently defined, and where the underlying data lives.
02
Agent Design and Scoping
We define standardized metrics, ranking logic, and anomaly thresholds before building anything.
03
Build and Integration
We connect the agent to each department system and the reporting destination. No IT team required on your side. We handle all integrations.
04
Pilot and Validation
The agent compares departments in parallel with your existing manual process for one full cycle. Accuracy is compared side by side before handoff.
05
Go-Live and Handoff
The agent takes over data pulls, comparison, and ranking. Your team keeps review authority over flagged anomalies. We monitor accuracy through the first three cycles.
01
Discovery and Department Metrics Audit
Free 30-minute call. No preparation needed. We map which metrics get compared across departments today, how they are currently defined, and where the underlying data lives.
Metric and department source assessment
Standardization and ranking logic mapping
Recommended agent configuration for your department mix

Reporting Automation by Industry

Built for your industry, not just your department

Each agent is configured for that sector's systems, rules, and compliance requirements.

Built Around Your Workflow

Your existing systems are already the source of truth

WorkAgentic builds each reporting agent around the systems, rules, and approval logic your team already uses. Nothing about how your team works today needs to change. The agent runs in the background, and your team reviews exceptions and keeps final say.

Zero new software for your team to learn. The agent runs inside your existing systems. Your team sees the output, not the engine.
100+
systems we connect to
Any API
if it exports data, we connect
N
NetSuite
SAP
SAP
SF
Salesforce
x
Xero
ORC
Oracle
D365
Dynamics
SGE
Sage
100+
more systems

Tableau, Looker, HubSpot, QuickBooks, Xero, data warehouses and any system with a structured API or data export

Case Studies

AI agents we have already built and deployed

Real deployments. Real outcomes. Each agent was built from scratch around the client's exact workflow.
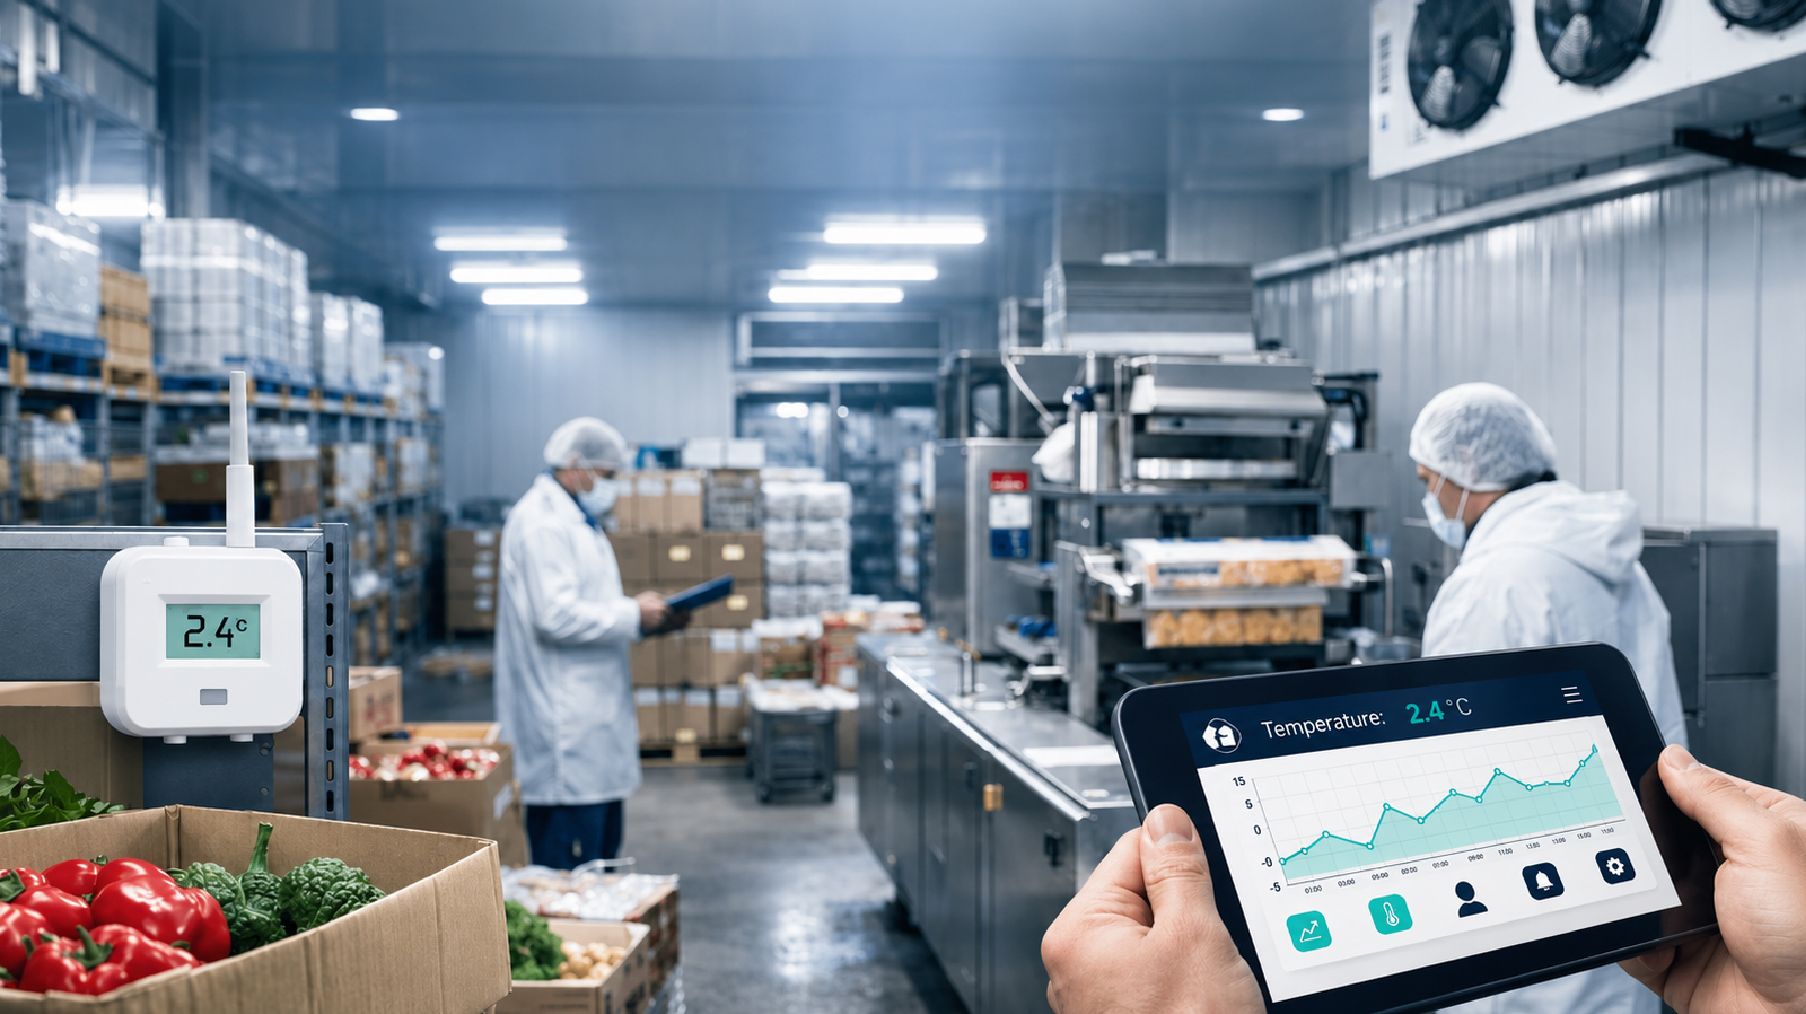
How a $150M Frozen Foods Distributor Eliminated Overnight Temperature Risk and Prevented $200K–$250K in Annual LossesFrozen Foods / CPG
How a $150M Frozen Foods Distributor Eliminated Overnight Temperature Risk and Prevented $200K–$250K in Annual Losses
A leading frozen foods distributor managed millions of dollars of temperature-sensitive inventory across its refrigerated fleet but had no visibility into trailer temperatures during overnight hours. This created a significant risk of product spoilage, inventory loss, and customer service disruptions.
How a $50M CPG Brand Replaced a $180K TPM System and Unlocked $300K in Annual Value Using Open-Source TPM and Agentic AICPG / Consumer Packaged Goods
How a $50M CPG Brand Replaced a $180K TPM System and Unlocked $300K in Annual Value Using Open-Source TPM and Agentic AI
A $50 million consumer packaged goods (CPG) brand was struggling with the growing complexity of trade promotion management. Despite investing heavily in a traditional TPM platform, many critical processes remained manual, including trade planning, accrual management, deduction reconciliation, customer profitability reporting, and trade spend analysis. The company was spending approximately $180,000 annually on TPM software while dedicating significant internal resources to managing promotions, deductions, and reporting activities.
How a $250M+ Frozen Food Manufacturer Cut Daily Inventory Reporting from 120 Minutes to 5 Minutes and Saved $44,000 AnnuallyFrozen Foods / CPG
How a $250M+ Frozen Food Manufacturer Cut Daily Inventory Reporting from 120 Minutes to 5 Minutes and Saved $44,000 Annually
A $250M+ frozen food manufacturer managed inventory across multiple third-party warehouses and cold storage facilities. Accurate inventory visibility was critical for supply planning, production scheduling, customer service, and inventory management. However, the company relied on a highly manual inventory reporting process that required data from twelve separate sources, including warehouse portals and accounting system reports, to be downloaded, reconciled, and consolidated twice each day.
How a $800M CPG Company Replaced OCR and Manual Data Entry with Agentic AI, Generating $592,000 in Annual Savings and a 4.6x ROICPG / Business Process Outsourcing
How a $800M CPG Company Replaced OCR and Manual Data Entry with Agentic AI, Generating $592,000 in Annual Savings and a 4.6x ROI
A leading business services provider supported multiple consumer packaged goods (CPG) companies with aggregate annual sales exceeding $800 million. The organization was responsible for transcribing retailer deduction documentation, validating deductions against trade promotion planners, proof-of-performance documents, and promotional contracts across multiple customers, channels, and retailer platforms. As client volumes increased, the process of extracting, validating, and transferring retailer data into spreadsheets, reports, and operational dashboards became increasingly dependent on manual labor.

Watch the Agent Work

See a cross-department reporting agent running live

A 3-minute walkthrough showing how the agent pulls a standardized metric from every department, ranks them against each other, and flags an outlier automatically.

The same metric pulled automatically from every department
Departments displayed side by side for direct comparison
Departments ranked automatically against each other and a benchmark
An outlier department flagged automatically within the report
Get Your Agent Today →

No commitment. We demo with a real reporting workflow, not a sandbox.

Cross-Department Reporting Agent Demo
3 min · No audio required

Built for Multi-Department Organizations

The right comparison view for every role

Each deployment is scoped around how a specific role depends on comparing departments fairly. Your COO, VP Finance, and department leaders each get what they need from a report that runs on its own.

COO
Chief Operating Officer

Stops finding out a department is underperforming only at year-end review. Gets it flagged well before then instead.

WHAT CHANGES
Every department visible side by side on the metrics that matter
Outlier departments flagged as part of routine reporting, not discovered late
Full comparison history available without asking the team to reconstruct it
Recurring underperformance patterns visible so they can actually be addressed
VP FINANCE
VP Finance

Stops rebuilding the comparison report from scratch every cycle. Gets it updated automatically instead.

WHAT CHANGES
Metrics standardized and compared automatically across every department
Anomalies surfaced first so review time goes where it matters
Ranking and benchmark reporting ready without a manual build
Time spent on analysis instead of assembling the comparison
DEPT LEADERS
Department Leaders

Stops wondering whether the comparison is even fair across departments. Gets standardized metrics instead.

WHAT CHANGES
Every department measured against the same standardized definition
Own department's detailed reporting still available alongside the comparison
Ranking and benchmark visible without waiting for a manual review
Coverage maintained as more departments join without added work
Meet Our CEO Haroon Jafree, CPA
25 years as a CFO and finance leader, designing agents around workflows he personally ran
About WorkAgentic

Start with cross-department reporting. Add more reporting automation agents as your team grows.

WorkAgentic deploys cross-department reporting that pulls the same defined metric from every department and presents it side by side, so leadership stops assembling that comparison by hand.

FAQ

Questions about cross-department reporting

Clear answers on how the agent standardizes and compares departments, and what your team stays responsible for.

Cross-department reporting agents are AI agents that pull the same defined metric, such as revenue, headcount, or expenses, from every department and present it side by side for direct comparison, without someone manually collecting and reformatting numbers from each department separately. WorkAgentic builds cross-department reporting agents for teams that need to compare performance across departments and currently assemble that comparison by hand each cycle.
Cross-functional management reporting follows a single process or initiative as it moves through multiple functions in sequence. Cross-department reporting compares the same type of metric side by side across separate departments, such as revenue by department, without following any single process between them. This page covers the side-by-side comparison agent. A separate cross-functional management reporting agent covers the process-following view.
Metric definitions are standardized once and applied consistently across every department, so a department calculating a metric slightly differently doesn't distort the comparison.
Yes. Departments can be ranked against each other or against a defined benchmark, so leadership can see which departments are ahead or behind on a given metric at a glance.
A department whose numbers fall well outside the pattern of the rest is flagged automatically, so an outlier gets noticed as part of routine reporting rather than only when someone compares the numbers manually.
Yes. New departments are added to the comparison using the same standardized metric definitions, without rebuilding the report from scratch.
Yes. The side-by-side comparison sits alongside each department's own detailed reporting, so cross-department comparison doesn't replace what a department already tracks for itself.
Zero new software for your team to learn. The agent runs inside your existing systems. Your team sees the output, not the engine.

Get Started

Ready to stop rebuilding the comparison by hand?

Book a free 30-minute cross-department reporting review. We map the metrics you compare across departments and show you where automation saves the most time first.

Book a Free Cross-Department Reporting Review