AI Agents for Operational Reporting

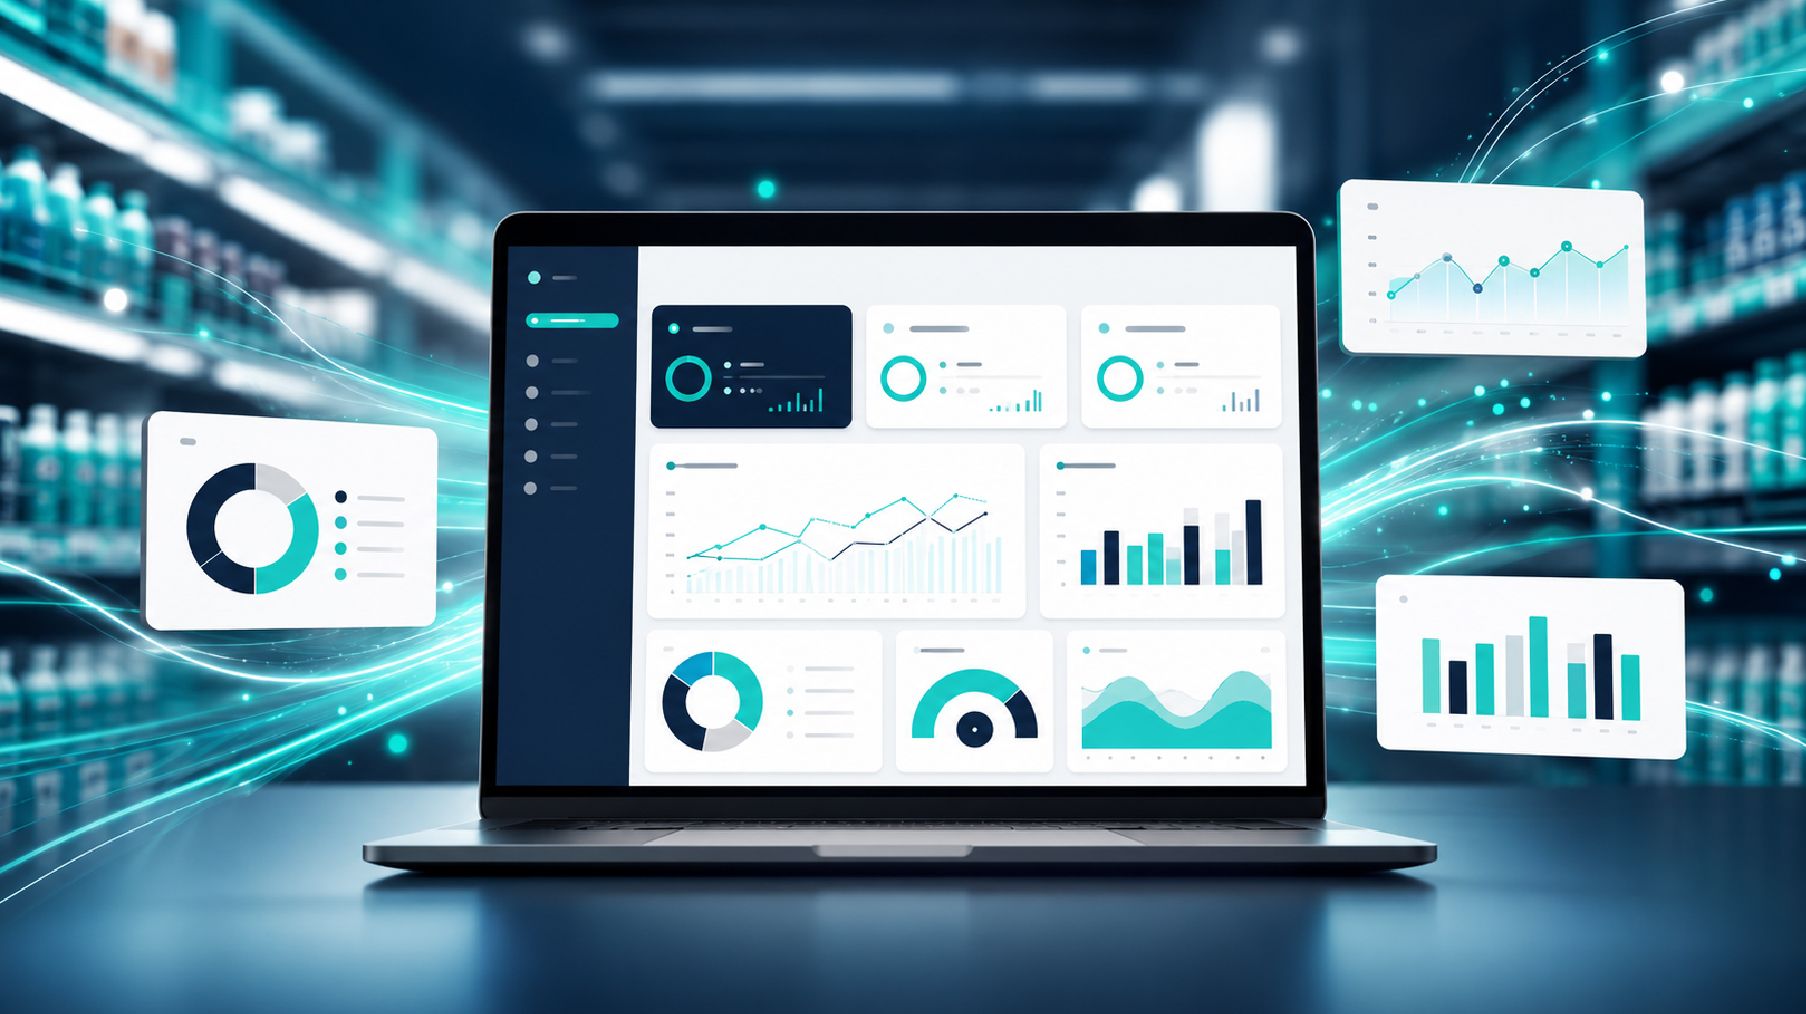
WorkAgentic builds AI agents for operational reporting that pull day-to-day metrics directly from your existing systems, so frontline managers stop starting every shift by manually assembling the same numbers.

★★★★★4.9 / 5
No technical team neededBuilt by CPAs
Book a Free Reporting Automation Review

No commitment. Response within 24 hours.

Operational Reporting

Six operational reporting tasks your team stops running manually

Each agent pulls the numbers directly from your systems and delivers the report automatically. No manual data pulls, no abnormal reading discovered only after it became a bigger problem.

Automatic Metric Collection

  • Operational metrics pulled automatically from every connected system
  • No manual export, copy, or paste required to assemble the report
  • Metrics collected on the schedule your team actually operates on
  • Collection rules configured once and reused across every reporting cycle
  • New metrics added without rebuilding the entire reporting pipeline

Multi-System Data Consolidation

  • Metrics from different operational systems combined into one consistent report
  • Field and unit differences reconciled automatically across systems
  • Report structure stays consistent even as underlying systems change
  • New systems added to the consolidated report without a manual rebuild
  • Source system tracked per metric for traceability

Abnormal Reading Flagging

  • Metrics falling outside a defined normal range flagged automatically
  • Normal ranges configured per metric based on your own historical patterns
  • Abnormal readings surfaced within the report, not buried in raw numbers
  • Seasonal or expected variation distinguished from a genuine anomaly
  • Nothing depends on someone happening to notice a number looked off

Role-Based Report Views

  • Report views configured per team or role instead of one-size-fits-all
  • Each team sees the metrics relevant to their own area first
  • Full underlying dataset still available for anyone who needs to drill down
  • View configurations updated without rebuilding the underlying report
  • New teams or roles added to the report without disrupting existing views

Flexible Reporting Cadence

  • Report cadence configured to match how your team actually operates
  • Continuous, per-shift, and daily cadences all supported natively
  • Different cadences configured per team where operational rhythms differ
  • On-demand refresh available whenever your team needs current numbers now
  • Cadence adjusted over time as operational needs change

Reporting History and Audit Log

  • Every report run logged with a timestamp and the underlying data pulled
  • Historical reports available for comparison without manual reconstruction
  • Corrections tracked so the original and revised numbers are both visible
  • Trend data available across reporting periods, not just the current cycle
  • History retained even after underlying source systems have changed

Client Reviews

What operations teams say after going live

4.8
★★★★★
Verified clients
★★★★★

Our shift supervisors spent the first thirty minutes of every shift manually pulling numbers from three different systems just to know where things stood. WorkAgentic delivers that report automatically now, before the shift even starts.

★★★★★

Warehouse throughput and customer service queue data lived in two completely separate systems, and nobody had one combined view of both. WorkAgentic consolidates them into a single report now, so we finally see the full operational picture.

★★★★★

A queue backlog crept up slowly over several days and nobody noticed it in the raw numbers until it was already a real problem. WorkAgentic flags abnormal readings automatically now, so a slow buildup gets caught early instead of after it snowballs.

★★★★★

Our fulfillment team and our support team both needed different slices of the same operational data, and building two separate reports took real time every week. WorkAgentic gives each team its own view of the same underlying report now, with zero extra maintenance.

★★★★★

Our store operations ran on a different rhythm than our distribution center, but our old reporting tool forced the same daily cadence on both. WorkAgentic runs each on its own schedule now, matched to how that team actually operates.

Our Process

How we deploy your operational reporting agent

Five structured steps from scoping to go-live. No disruption to your current systems or team workflows.

01
Discovery and Metrics Audit
Free 30-minute call. We map the metrics your team tracks today, the systems they live in, and how the current report gets assembled.
02
Agent Design and Scoping
We define metrics, normal ranges, cadence, and role-based views before building anything.
03
Build and Integration
We connect the agent to your operational systems and reporting destination. No IT team required on your side. We handle all integrations.
04
Pilot and Validation
The agent generates the report in parallel with your existing manual process for one full cycle. Accuracy is compared side by side before handoff.
05
Go-Live and Handoff
The agent takes over metric collection, consolidation, and delivery. Your team keeps review authority over flagged readings. We monitor accuracy through the first three cycles.
01
Discovery and Metrics Audit
Free 30-minute call. No preparation needed. We map the metrics your team tracks today, the systems they live in, and how the current report gets assembled.
Metric and source system assessment
Normal range and cadence mapping per team
Recommended agent configuration for your metric mix

Reporting Automation by Industry

Built for your industry, not just your department

Each agent is configured for that sector's systems, rules, and compliance requirements.

Built Around Your Workflow

Your existing systems are already the source of truth

WorkAgentic builds each reporting agent around the systems, rules, and approval logic your team already uses. Nothing about how your team works today needs to change. The agent runs in the background, and your team reviews exceptions and keeps final say.

Zero new software for your team to learn. The agent runs inside your existing systems. Your team sees the output, not the engine.
100+
systems we connect to
Any API
if it exports data, we connect
N
NetSuite
SAP
SAP
SF
Salesforce
x
Xero
ORC
Oracle
D365
Dynamics
SGE
Sage
100+
more systems

Tableau, Looker, HubSpot, QuickBooks, Xero, data warehouses and any system with a structured API or data export

Case Studies

AI agents we have already built and deployed

Real deployments. Real outcomes. Each agent was built from scratch around the client's exact workflow.
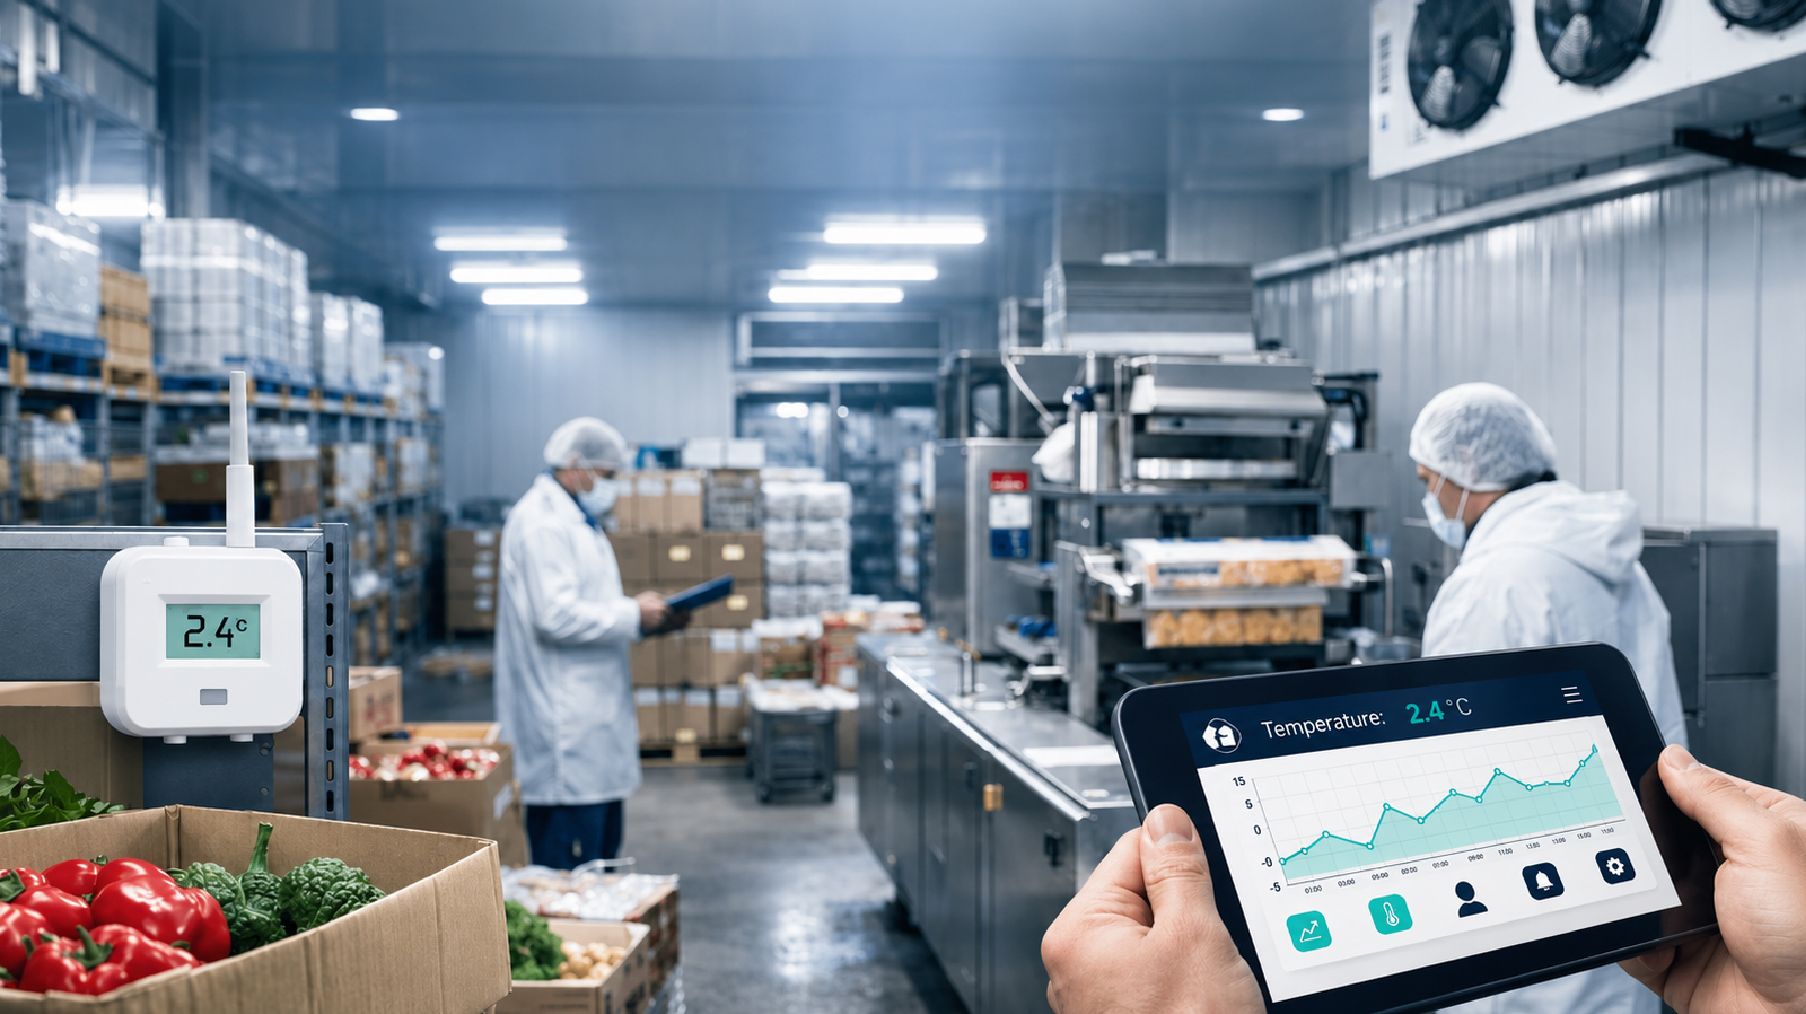
How a $150M Frozen Foods Distributor Eliminated Overnight Temperature Risk and Prevented $200K–$250K in Annual LossesFrozen Foods / CPG
How a $150M Frozen Foods Distributor Eliminated Overnight Temperature Risk and Prevented $200K–$250K in Annual Losses
A leading frozen foods distributor managed millions of dollars of temperature-sensitive inventory across its refrigerated fleet but had no visibility into trailer temperatures during overnight hours. This created a significant risk of product spoilage, inventory loss, and customer service disruptions.
How a $50M CPG Brand Replaced a $180K TPM System and Unlocked $300K in Annual Value Using Open-Source TPM and Agentic AICPG / Consumer Packaged Goods
How a $50M CPG Brand Replaced a $180K TPM System and Unlocked $300K in Annual Value Using Open-Source TPM and Agentic AI
A $50 million consumer packaged goods (CPG) brand was struggling with the growing complexity of trade promotion management. Despite investing heavily in a traditional TPM platform, many critical processes remained manual, including trade planning, accrual management, deduction reconciliation, customer profitability reporting, and trade spend analysis. The company was spending approximately $180,000 annually on TPM software while dedicating significant internal resources to managing promotions, deductions, and reporting activities.
How a $250M+ Frozen Food Manufacturer Cut Daily Inventory Reporting from 120 Minutes to 5 Minutes and Saved $44,000 AnnuallyFrozen Foods / CPG
How a $250M+ Frozen Food Manufacturer Cut Daily Inventory Reporting from 120 Minutes to 5 Minutes and Saved $44,000 Annually
A $250M+ frozen food manufacturer managed inventory across multiple third-party warehouses and cold storage facilities. Accurate inventory visibility was critical for supply planning, production scheduling, customer service, and inventory management. However, the company relied on a highly manual inventory reporting process that required data from twelve separate sources, including warehouse portals and accounting system reports, to be downloaded, reconciled, and consolidated twice each day.
How a $800M CPG Company Replaced OCR and Manual Data Entry with Agentic AI, Generating $592,000 in Annual Savings and a 4.6x ROICPG / Business Process Outsourcing
How a $800M CPG Company Replaced OCR and Manual Data Entry with Agentic AI, Generating $592,000 in Annual Savings and a 4.6x ROI
A leading business services provider supported multiple consumer packaged goods (CPG) companies with aggregate annual sales exceeding $800 million. The organization was responsible for transcribing retailer deduction documentation, validating deductions against trade promotion planners, proof-of-performance documents, and promotional contracts across multiple customers, channels, and retailer platforms. As client volumes increased, the process of extracting, validating, and transferring retailer data into spreadsheets, reports, and operational dashboards became increasingly dependent on manual labor.

Watch the Agent Work

See an operational reporting agent running live

A 3-minute walkthrough showing how the agent pulls metrics from multiple systems, consolidates them into one report, flags an abnormal reading, and delivers role-based views to two different teams.

Metrics pulled automatically from multiple operational systems
Data consolidated into one consistent report across systems
An abnormal reading flagged automatically within the report
Role-based views delivered to two different teams from one underlying report
Get Your Agent Today →

No commitment. We demo with a real reporting workflow, not a sandbox.

Operational Reporting Agent Demo
3 min · No audio required

Built for Frontline Operations Teams

The right reporting setup for every role

Each deployment is scoped around how a specific role depends on current operational data. Your COO, operations manager, and frontline team each get what they need from a report that runs on its own.

COO
Chief Operating Officer

Stops finding out about an operational slowdown only after it's already affected customers. Gets it flagged in the daily report instead.

WHAT CHANGES
Operational metrics visible across every team without a manual pull
Abnormal readings flagged as part of routine reporting, not discovered later
Full reporting history available without asking the team to reconstruct it
Recurring operational issues visible so they can actually be addressed
OPERATIONS
Operations Manager

Stops starting every shift by manually pulling the same numbers. Gets a live report ready before the shift begins instead.

WHAT CHANGES
Report ready and current at the start of every shift automatically
Abnormal readings surfaced first so attention goes where it matters
Report matched to your team's cadence, not forced onto a generic schedule
Time spent running the operation instead of assembling the report
FRONTLINE TEAM
Frontline Team

Stops pulling the same numbers from three systems every day. Gets a single, current view instead.

WHAT CHANGES
Relevant metrics delivered automatically without a manual pull
Each team sees its own relevant view, not the entire dataset
Full underlying data still available to drill down when needed
More time on the actual work, not on assembling the report
Meet Our CEO Haroon Jafree, CPA
25 years as a CFO and finance leader, designing agents around workflows he personally ran
About WorkAgentic

Start with operational reporting. Add more reporting automation agents as your team grows.

WorkAgentic deploys operational reporting that pulls day-to-day metrics directly from your existing systems, so frontline managers stop assembling the same numbers by hand.

FAQ

Questions about operational reporting

Clear answers on how the agent collects metrics, flags abnormal readings, and what your team stays responsible for.

Operational reporting agents are AI agents that pull day-to-day operational metrics, such as throughput, cycle time, and queue volumes, directly from your existing systems and deliver them as a standing report, without a person manually pulling and formatting the numbers each day. WorkAgentic builds operational reporting agents for teams whose frontline managers currently spend part of every morning assembling the same operational numbers by hand before the day can start.
Operational reporting covers granular, high-frequency metrics, such as daily throughput or queue backlogs, that frontline and operations teams check constantly to run day-to-day work. Performance reporting covers periodic, higher-level reporting on how a team or business unit is performing against goals over weeks or months. This page covers the granular, daily operational agent. A separate performance reporting agent covers the periodic goal-tracking report.
A KPI dashboard is a live, continuously monitored view tracking a defined set of KPIs against targets. Operational reporting is a broader, more detailed report covering the full operational picture, not limited to a fixed KPI set, and can be delivered as a document or summary rather than only a live dashboard. The two are often used together: this page covers the underlying operational report; a separate KPI dashboard agent covers the live monitoring view.
Yes. Metrics from multiple operational systems, such as a warehouse management system and a customer service platform, are pulled and combined into one consistent report automatically.
Update frequency is configured to match how your team actually operates, whether that's continuously throughout the day, once per shift, or once daily, so the numbers are current when your team actually needs them.
Yes. Report views are configured per team or role, so a warehouse supervisor and a customer service lead each see the operational metrics relevant to their own area without wading through the full dataset.
Metrics falling outside a defined normal range are flagged within the report, so an abnormal reading gets noticed as part of routine reporting rather than only when someone happens to dig into the raw numbers.
Zero new software for your team to learn. The agent runs inside your existing systems. Your team sees the output, not the engine.

Get Started

Ready to stop pulling the same numbers by hand?

Book a free 30-minute operational reporting review. We map your current metrics and manual process and show you where automation removes the most manual work first.

Book a Free Operational Reporting Review